
Dave Troy
Name: Dave Troy
Innovation: Using Twitter data to map Baltimore’s racial and cultural divides about tree planting
Innovation: Using Twitter data to map Baltimore’s racial and cultural divides about tree planting
Age: 42
Home: Bolton Hill
Occupation: CEO of a technology company
Twitter-data maps reveal tough realities about city’s racial and cultural divides
By Michael Cross-Barnet
Photography by James Sneed
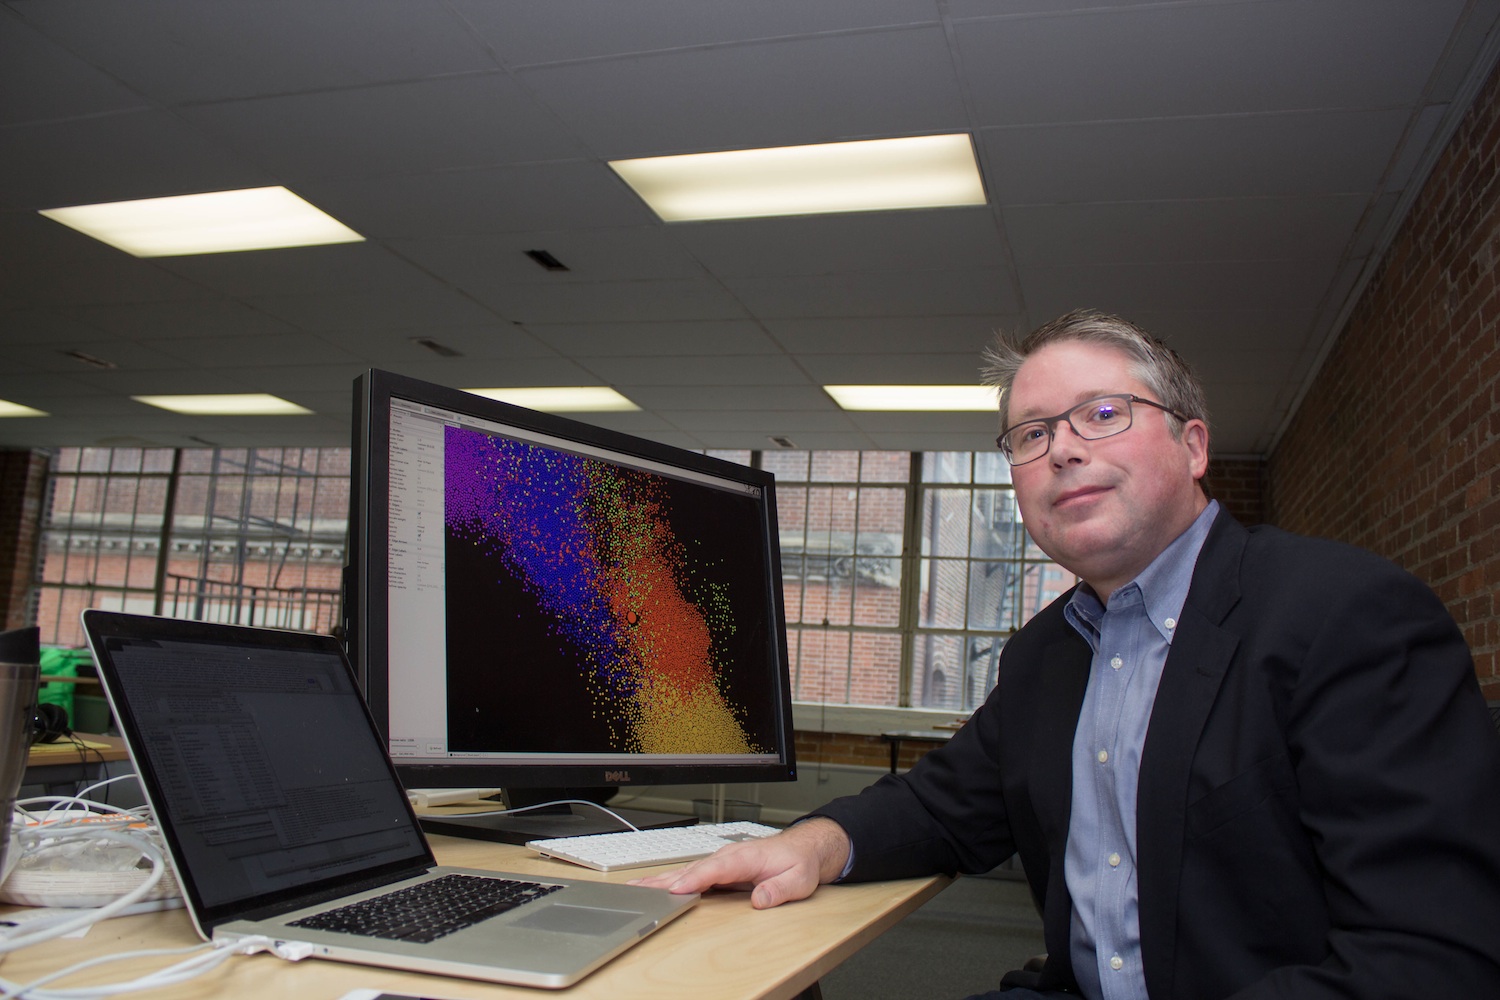
Dave Troy sees Baltimore in black and white – and purple, green and yellow. The colorful maps he creates using Twitter data and algorithms he has developed vividly reveal the city’s racial and social divisions. They show just how vast the gulf is between white and black Baltimore, although Troy’s data also suggest a more complicated situation, where culture and economics rival race in significance.
Among people who use the Internet, blacks and Hispanics are on Twitter at three times the rate of whites, which makes Twitter ideal for gauging attitudes and preferences in minority communities, Troy says. Well-educated whites are a minority of city residents but a majority of those who control elite financial and cultural institutions, including nonprofits whose services target poor African-Americans. The two groups should have a lot to say to each other, but Troy’s preliminary data suggest that they are worlds apart.
“Frankly, most people who aren’t your ‘color’ have never heard of you. … But if these are people you feel you should be reaching, maybe they should know about you.”
For example, the maps indicate that large numbers of blacks and Latinos in Baltimore are fans of DMVFollowers, a Twitter-based news source that few middle-class white people know about but which is probably more influential than The Baltimore Sun in much of the city.
“We’re all living here amongst each other, but our paths don’t cross,” says Troy, a serial tech entrepreneur originally from Anne Arundel County who lives in Bolton Hill with his wife and two children. Most city residents on both sides of the divide simply do not interact with people from the “other Baltimore,” though if they did, they could learn a lot from each other.
By tracking and organizing massive amounts of publicly available Twitter data – including who users’ friends and followers are – Troy is mapping how Baltimoreans organize themselves socially. One map shows a big orange cluster on one end representing the largely black demographic that follows DMV; on the other end is a green bubble of largely white elites who populate the nonprofit world and care about things like TED Talks. There is almost no overlap between the orange and green groups; the only true “connective tissue” between them is sports: the Ravens and the Orioles.
The same tools that show just how stratified Baltimore is along race, class and social lines also may hold some clues about how to start bringing down those walls. Troy thinks that could lead the way to a transition from the misleading “Smalltimore” mentality to a concept he calls “All-timore” – where people from various groups acknowledge their differences, share their experiences and strive for common ground, or at least mutual understanding.
Troy says that won’t happen until different kinds of people start actually spending time together, and he sees his maps as a potential catalyst for connecting people who live near each other but who may have little in common.
“Frankly, most people who aren’t your ‘color’ have never heard of you. … But if these are people you feel you should be reaching, maybe they should know about you,” Troy says.